Preface
BOOK PROPOSAL DRAFT
The journey of a thousand miles begins with one step.
— Lao Tzu
The essential questions for the preface are:
- What is the rationale for this textbook?
- What are the aims and the approach taken in this textbook?
- How is the textbook designed to support attaining these aims?
- What is needed to get started?
This chapter aims to provide a brief summary of current research trends that form the context for the rationale for this textbook. It also provides instructors and readers an overview of the aims and approach of the textbook, a description of the main components of each section and chapter, a guide to conventions used in the book, and a summary of the supporting resources available. Additionally information on setting up your computing environment and where to seek support is included.
Rationale
In recent years there has been a growing buzz around the term ‘Data Science’ and related terms; data analytics, data mining, etc. In a nutshell data science is the process by which an investigator leverages statistical methods and computational power to uncover insight from machine-readable data sources. Driven in large part by the increase in computing power available to the average individual and the increasing amount of electronic data that is now available through the internet, interest in data science has expanded to virtually all fields in academia and areas in the public sector.
This textbook is an introduction to the fundamental concepts and practical programming skills from data science applied to the task of quantitative text analysis. The intended readership for this textbook is primarily undergraduate students but may also be applicable to graduate students and researchers looking to expand their methodological toolbox. This textbook aims to meet the growing interest in quantitative data analysis methods taking hold across linguistics subfields and language-informed disciplines (digital humanities, political science, economics, inter alia). To ensure that this resource is accessible to a wide variety of students and researchers it does not assume a background in linguistics. Additionally, some readers interested in the aforementioned disciplines may lack experience with and/ or feel hesitant towards statistical methods and/ or programming. To make this textbook attractive to novices in quantitative text analysis methods, I will make no assumptions about the reader’s experience with quantitative data analysis or programming, in general, or programming with the statistical programming language R, in particular.
Aims
This textbook aims to develop the reader’s proficiency in three main areas:
Data literacy: the ability to interpret, assess, and contextualize findings based on data. Throughout this textbook we will explore topics which will help you understand how data analysis methods derive insight from data. In this process you will be encouraged to critically evaluate connections across linguistic and language-related disciplines using data analysis knowledge and skills. Data literacy is an invaluable skillset for academics and professionals but also is an indispensable aptitude for in the 21st century citizens to navigate and actively participate in the ‘Information Age’ in which we live (Carmi, Yates, Lockley, & Pawluczuk, 2020).
Research skills: the ability to conduct original research, communicate findings, and make meaningful connections with findings in the literature of the field. This target area does not differ significantly, in spirit, from common learning outcomes in a research methods course: identify an area of investigation, develop a viable research question or hypothesis, collect relevant data, analyze data with relevant statistical methods, and interpret and communicate findings. However, working with text will incur a series of key steps in the selection, collection, and preparation of the data that are unique to text analysis projects. In addition, I will stress the importance of research documentation and creating reproducible research as an integral part of modern scientific inquiry (Buckheit & Donoho, 1995).
Programming skills: the ability to implement research skills programmatically and produce research that is replicable and collaborative. Modern data analysis, and by extension, text analysis is conducted using programming. There are various key reasons for this: (1) programming affords researchers unlimited research freedom –if you can envision it, you can program it. The same cannot be said for off-the-shelf software which is either proprietary or unmaintained –or both. (2) Programming underlies well-documented and reproducible research –documenting button clicks and menu option selections leads to research which is not readily reproduced, either by some other researcher or by your future self! (3) Programming forces researchers to engage more intimately with the data and the methods for analysis. The more familiar you are with the data and the methods the more likely you are to produce higher quality work.
Resources
This textbook includes three resources to support learning in the areas of Data literacy, Research skills, and Programming skills in a systematic chapter-related fashion: 1) the textbook itself which includes prose discussion, figures/tables, R code, and thought and practical exercises, 2) a companion website “Text as Data Resources” which includes programming tutorials and demonstrations to develop and augment the reader’s recognition of how programming strategies are implemented, and 3) a GitHub repository which contains both a set of interactive R programming lessons (Swirl) and lab exercises which guide the reader through practical hands-on programming applications.
Structure
In Part I “Foundations” the aims are to: 1) provide an overview of quantitative research and their applications, by both highlighting visible applications and notable research in various fields, 2) consider how quantitative research contributes to language research, and 3) layout the main types of research and situate quantitative text analysis inside these.
In Part II “Orientation” we will build up a framework to contextualize quantitative data analysis using the Data to Insight (DIKI) Hierarchy in Figure 0.1 1.
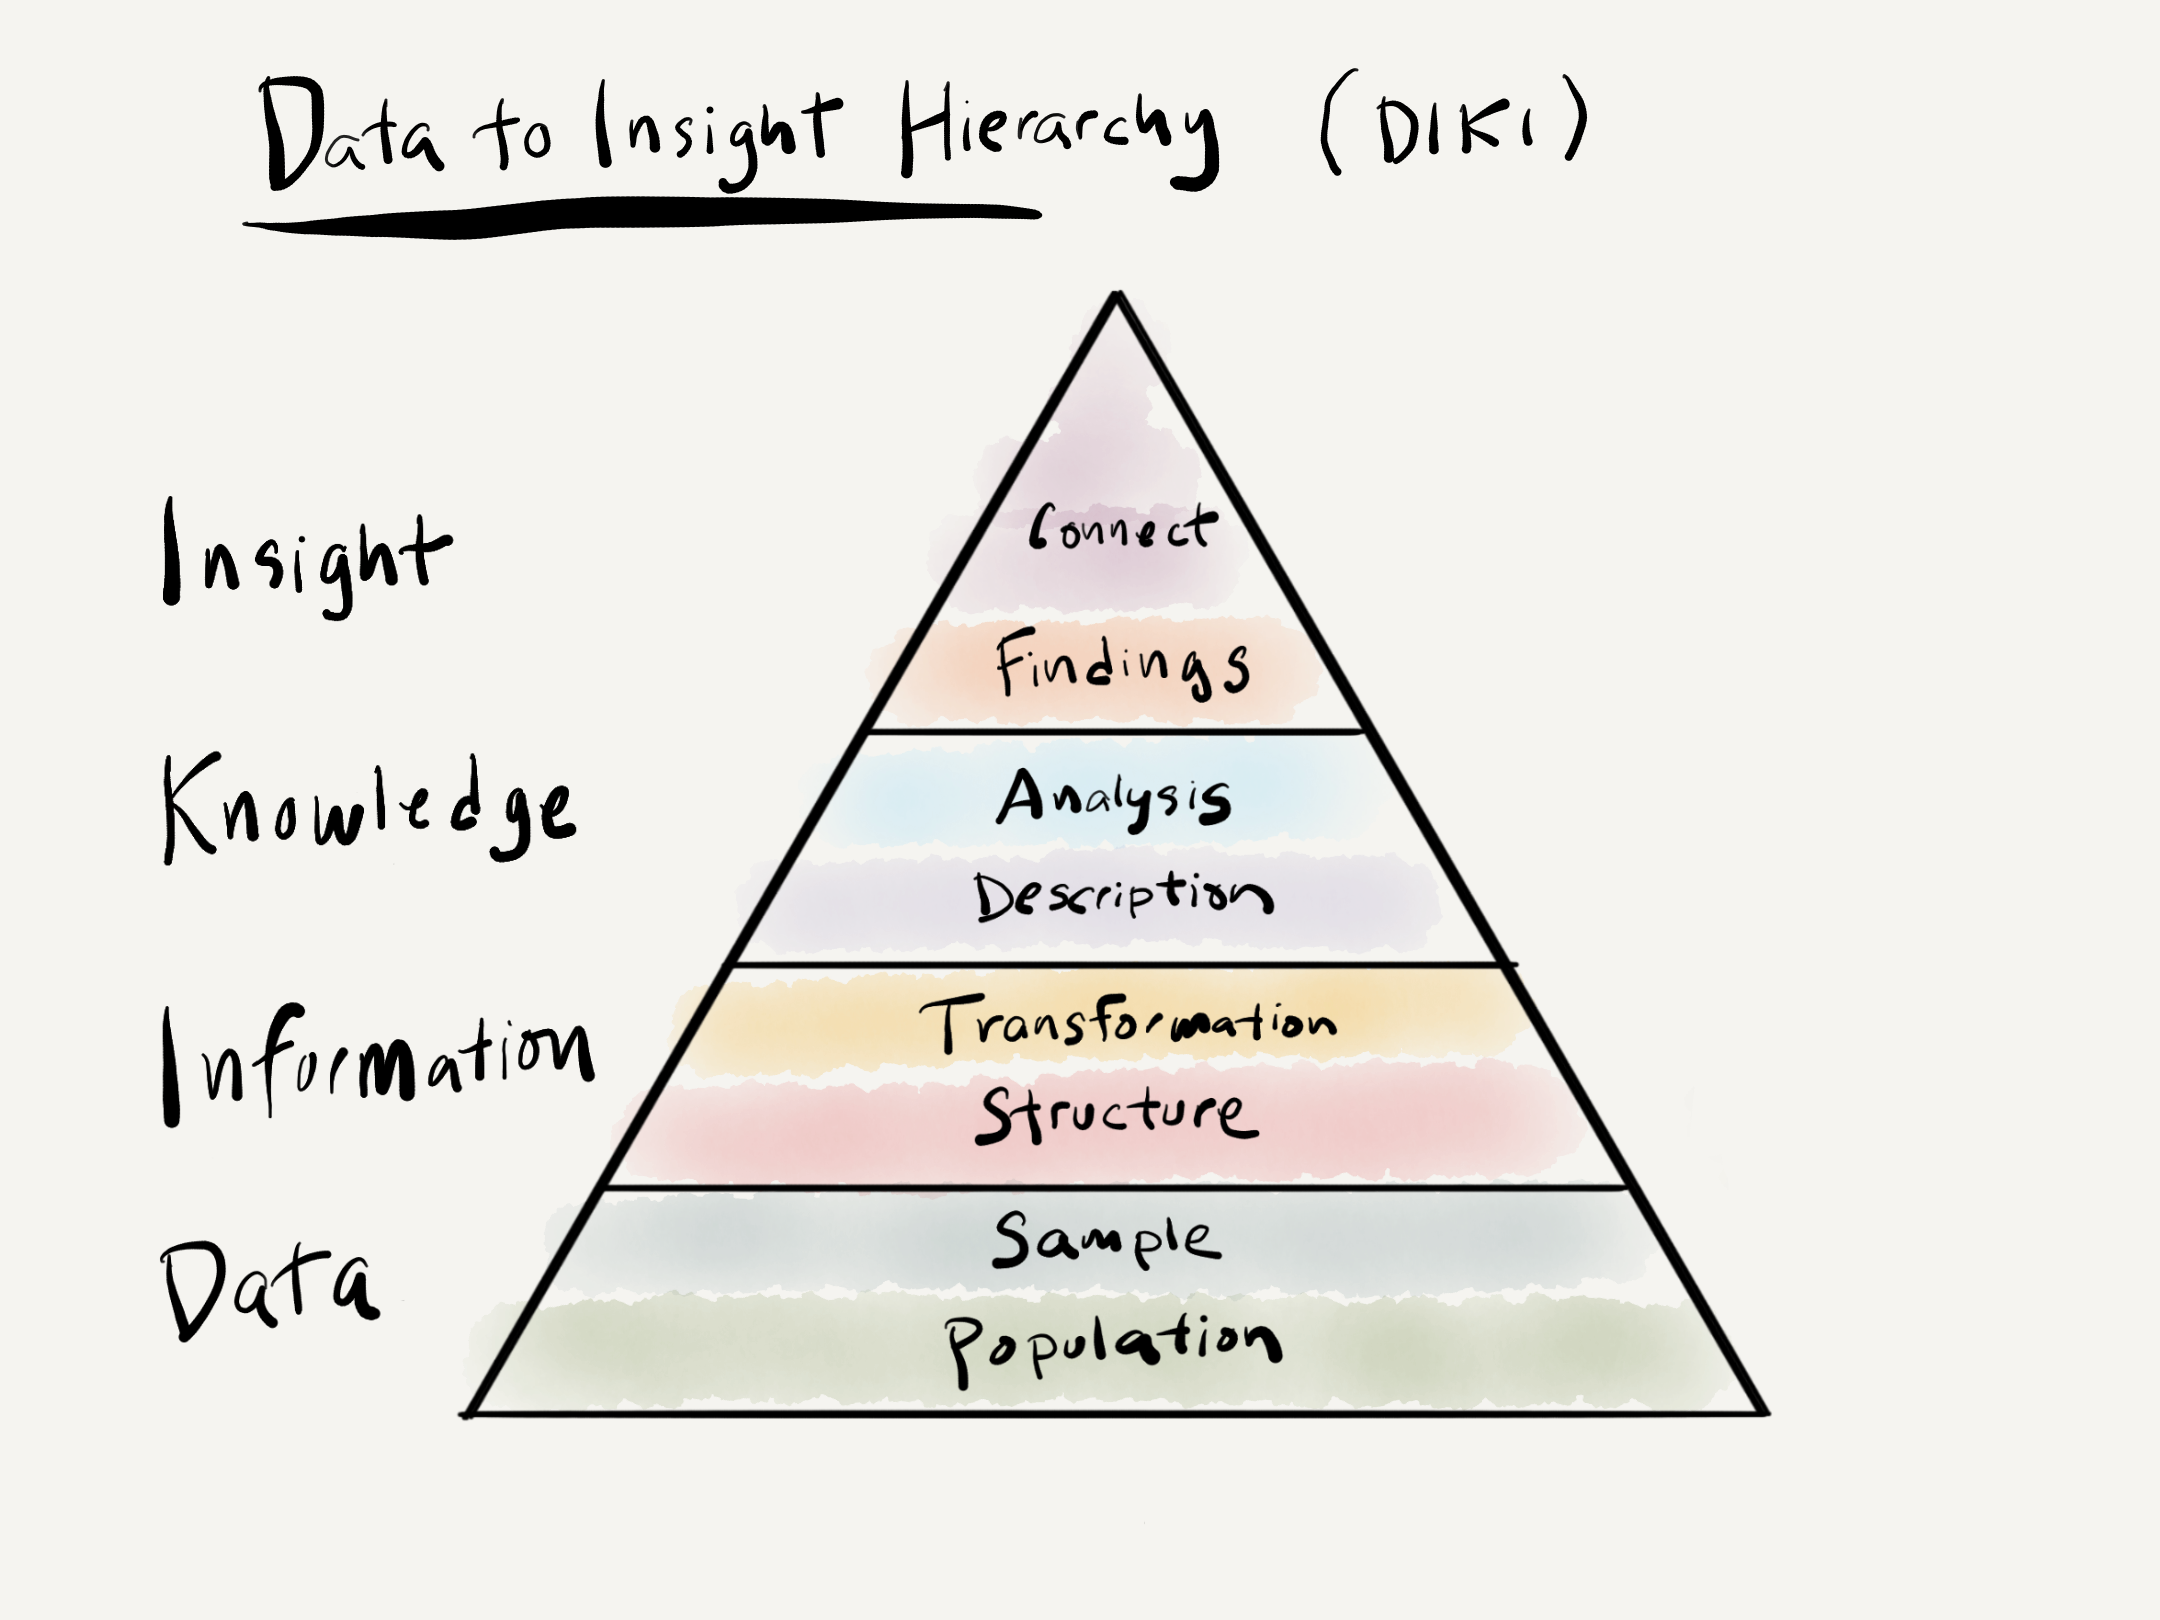
Figure 0.1: Data to Insight Hierarchy (DIKI)
The DIKI Hierarchy highlights the stages and intermediate steps required to derive insight from data. Chapter 2 “Understanding data” will cover both Data and Information covering the conceptual topics of populations versus samples and how language data samples are converted to information and the forms that they can take. In Chapter 3 “Approaching analysis” I will discuss the distinction between descriptive and analytic statistics. In brief they are both important for conducting data analysis, but descriptive statistics serve as a sanity check on the dataset before submitting it to interrogation –which is the goal of analytic statistics. We will also cover some of the main distinctions between analytics approaches including inference-, exploration-, and prediction-based methods. With a fundamental understanding of data, information, and knowledge we will then move to Chapter 4 “Framing research” where we will discuss how to develop a research plan, or what I will call a ‘research blueprint’. At this point we will directly address Research Skills and elaborate on how research really comes together; how to bring yourself up to speed with the literature on a topic, how to develop a research goal or hypothesis, how to select data which is viable to address the research goal or hypothesis, how to determine the necessary information and appropriate measures to prepare for analysis, how to perform diagnostic statistics on the data and make adjustments before analysis, how to select and perform the relevant analytic statistics given the research goals, how to report your findings, and finally, how to structure your project so that it is well-documented and reproducible.
Part III “Preparation” and Part IV “Analysis” serve as practical and more detailed guides to the R programming strategies to conduct text analysis research and as such develop your Programming Skills. In Chapter 5 “Acquire data” I will discuss three main strategies for accessing data: direct downloads, Automatic Programming Interfaces (APIs), and web scraping. In Chapter 6 “Curate data(sets)” I will outline the process for converting or augmenting the acquired data or dataset into a (more) structured format, therefore creating information. This will include organizing linguistic and non-linguistic metadata into one dataset. In Chapter 7 “Transform datasets” I describe how to work with a curated dataset to derive more detailed information and appropriate dataset structures that are appropriate for the subsequent analysis.
Chapters 8 “Inference”, 9 “Prediction”, and 10 “Exploration” focus on different categories of statistical analysis each associated with distinct research goals. Inference deals with analysis methods associated with standard hypothesis-testing. This will include some common statistical models employed in text analysis: chi-squared, logistic regression, and linear regression. Prediction covers methods for modeling associations in data with the aim to accurately predict outcomes using new textual data. I will cover some standard methods for text classification including Näive Bayes, k-nearest neighbors (k-NN), and decisions tree and random forest models. Exploration covers a variety of analysis methods such as association measures, clustering, topic modeling, and vector-space models. These methods are aligned with research goals that aim to interpret patterns that arise in from the data itself.
Part V “Communication” covers the steps in presenting the findings of the research both as a research document and as a reproducible research project. Both research documents and reproducible projects are fundamental components of modern scientific inquiry. On the one hand a research document, covered in Chapter 11 “Reporting”, provides readers a detailed summary of the main import of the research study. On the other hand making the research project available to interested readers, covered in Chapter 12 “Collaboration”, ensures that the scientific community can gain insight into the process implemented in the research and thus enables researchers to vet and extend this research to build a more robust and verifiable research base.
Conventions
This textbook is about the concepts for understanding and the techniques for doing quantitative text analysis with R. Therefore there will be an intermingling of prose and code presented. As such, an attempt to establish consistent conventions throughout the text has been made to signal the reader’s attention as appropriate.
In terms of prose, key concepts will be signaled using bold. As we explore concepts, R code itself will be incorporated into the text.
For example, the following text block shows actual R code and the results that are generated when running this code. Note that the hashtag # signals a code comment. The code follows within the same text block and a subsequent text block displays the output of the code.
# Add 1 plus 1
1 + 1
#> [1] 2
Inline code will be used when code blocks are short and the results are not needed for display. For example, the same code as above will sometimes appear as 1 + 1.
When necessary meta-description of code will appear. This is particularly relevant for R Markdown documents.
```{r test-code}
1 + 1
```
There is a series of text blocks that will be used to signal the reader’s attention to: key points, concept questions, case studies, swirl lessons, programming tutorials, lab exercises, tips, and warnings.
Key points summarize the main points to be covered in a chapter or a subsection of the text.
The essential questions for the preface are:
- What is the rationale for this textbook?
- What are the aims and the approach taken in this textbook?
- How is the textbook designed to support attaining these aims?
- What is needed to get started?
From time to time there will be points for you to consider and questions to explore.
Consider the objectives in this course: what ways can the knowledge and skills you will learn benefit you in your academic studies and/ or professional and personal life?
Case studies are provided in-line which highlight key concepts and/ or methodological approaches relevant to the current topic or section.
Swirl interactive R programming lessons appear at the beginning of each chapter. The lessons provide a guided environment to experience running code in the R console. The instructions to install the swirl package and the textbook lessons can be found on the “Text as Data Resources” site or directly from GitHub.
What: Intro to Swirl
How: In the R Console pane load swirl, run
swirl(), and follow prompts to select the lesson.
Why: To familiarize you with navigating, selecting, and
completing swirl lessons.
At the end of each chapter, a text block will provide readers a cue to explore the applied programming demonstrations called “Recipes” on the “Text as Data Resources” site. Readers may add online annotations using the built-in social annotation tool hypothes.is. Note: Instructors may opt to create their own private Hypothes.is annotation group.
What: Literate
programming I
How: Read Recipe 1 and participate in the Hypothes.is
online social annotation.
Why: To introduce the concept of Literate Programming
using R, RStudio, and R Markdown.
Hands-on lab activities to implement and extend programming strategies round out each chapter. These labs are found on GitHub and can be downloaded and/ or cloned to any RStudio instance (either your computer or on the web RStudio Cloud).
What: Literate programming I
How: Clone, fork, and complete the steps in
Lab 1.
Why: To put literate programming techniques covered in
Recipe 1 into practice. Specifically, you will create and edit an R
Markdown document and render a report in PDF format.
Tips are used to signal helpful hints that might otherwise be overlooked.
During a the course of an exploratory work session, many R objects
are often created to test ideas. At some point inspecting the workspace
becomes difficult due to the number of objects displayed using
ls().
To remove all objects from the workspace, use
rm(list = ls()).
Errors will be an inevitable part of learning to code, but some errors can be avoided. The text will used the warning text block to highlight common pitfalls and errors.
Hello world!
This is a warning.
Although this is not intended to be a in-depth introduction to statistical techniques, mathematical formulas will at times be included in the text. These formulas will appear either inline \(1 + 1 = 2\) or as block equations.
\[\begin{equation} \hat{c} = \underset{c \in C} {\mathrm{argmax}} ~\hat{P}(c) \prod_i \hat{P}(w_i|c) \tag{0.1} \end{equation}\]
Data analysis leans heavily on graphical representations. Figures will appear numbered, as in Figure 0.2.
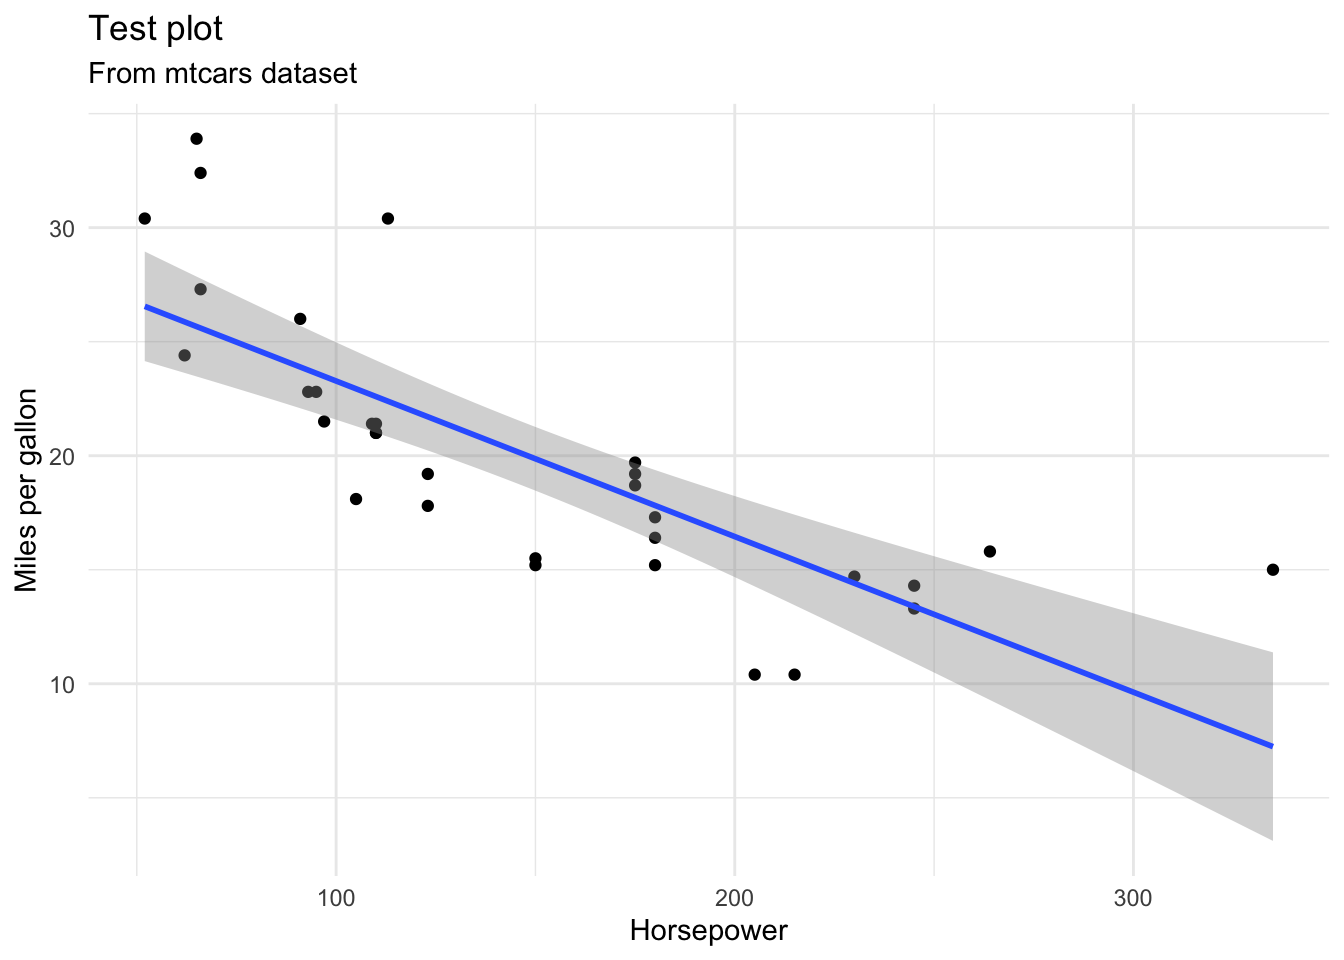
Figure 0.2: Test plot from mtcars dataset
Tables, such as Table 0.1 will be numbered separately from figures.
| Sepal.Length | Sepal.Width | Petal.Length | Petal.Width | Species |
|---|---|---|---|---|
| 5.1 | 3.5 | 1.4 | 0.2 | setosa |
| 4.9 | 3.0 | 1.4 | 0.2 | setosa |
| 4.7 | 3.2 | 1.3 | 0.2 | setosa |
| 4.6 | 3.1 | 1.5 | 0.2 | setosa |
| 5.0 | 3.6 | 1.4 | 0.2 | setosa |
| 5.4 | 3.9 | 1.7 | 0.4 | setosa |
| 4.6 | 3.4 | 1.4 | 0.3 | setosa |
| 5.0 | 3.4 | 1.5 | 0.2 | setosa |
| 4.4 | 2.9 | 1.4 | 0.2 | setosa |
| 4.9 | 3.1 | 1.5 | 0.1 | setosa |
| 5.4 | 3.7 | 1.5 | 0.2 | setosa |
| 4.8 | 3.4 | 1.6 | 0.2 | setosa |
| 4.8 | 3.0 | 1.4 | 0.1 | setosa |
| 4.3 | 3.0 | 1.1 | 0.1 | setosa |
| 5.8 | 4.0 | 1.2 | 0.2 | setosa |
| 5.7 | 4.4 | 1.5 | 0.4 | setosa |
| 5.4 | 3.9 | 1.3 | 0.4 | setosa |
| 5.1 | 3.5 | 1.4 | 0.3 | setosa |
| 5.7 | 3.8 | 1.7 | 0.3 | setosa |
| 5.1 | 3.8 | 1.5 | 0.3 | setosa |
Getting started
Before jumping in to the first chapter of this textbook, it is important to prepare your computing environment and understand how to take advantage of the resources available, both those directly associated with the textbook and indirectly associated.
R and RStudio
Programming is the backbone for modern quantitative research. R is a popular programming language with statisticians and was adopted by many other fields in natural and social sciences. It is freely downloadable from The R Project for Statistical Programming website and is available for macOS, Linux, and Windows operating systems.
While R code can be written and executed in many different environments, RStudio provides a very powerful interface that has been widely adopted by R programmers. RStudio is an IDE (Integrated Development Environment) and serves as a dashboard for working with R –therefore you must download and install R before installing RStudio. You may choose to run RStudio on your own computer (RStudio Desktop) or use RStudio on the web (RStudio Cloud). There are advantages to both approaches. Either approach will be compatible with this textbook but if you plan to continue to work with R/RStudio in the future at some point you will most likely want to install the desktop version and maintain your own R and RStudio environment.
For more details to install R and RStudio consult the RStudio Education page.
R packages
Throughout your R programming journey you will take advantage of code created by other R users in the form of packages. A package is a downloadable set of functions and/ or datasets which aim to accomplish a given cohesive set of related tasks. There are official R package repositories such as CRAN (Comprehensive R Archive Network) and other packages are available on code-sharing repositories such as GitHub.
The Comprehensive R Archive Network (CRAN) includes groupings of popular packages related to a given applied programming task called Task Views. Explore the available CRAN Task Views listings. Note the variety of areas (tasks) that are covered in this listing. Now explore in more detail one of the following task views which are directly related to topics covered in this textbook noting the associated packages and their descriptions: (1) Cluster, (2) MachineLearning, (3) NaturalLanguageProcessing, or (4) ReproducibleResearch.
You will download a number of packages at different stages of this textbook, but there is a set of packages that will be key to have from the get go. Once you have access to a working R/ RStudio environment, you can proceed to install the following packages.
Install the following packages from CRAN.
tidyversermarkdown-
tinytex
devtoolsusethisswirl
You can do this by running the following code in the RStudio Console pane.
install.packages(c("tidyverse", "rmarkdown", "tinytex", "devtools", "usethis", "swirl")) # install key packages from CRANOr you can use the RStudio Packages pane and click ‘Install’ and type the names of the packages.
This textbook includes a support package tadr which is available on GitHub (source code). To install this package from a GitHub repository, you run the following code in the RStudio Console pane:
devtools::install_github("lin380/tadr") # install the tadr package from GitHubFinally, although not a package we will need to download the interactive R programming lessons for this textbook that will be accessed with the swirl package. Download these lessons by running the following code in the RStudio Console pane.
swirl::install_course_github("lin380", "swirl") # install the swirl lessons for this textbookLater in this Preface and then at the beginning of each subsequent chapter there will be swirl lessons to complete. To load and choose a lesson to start, you will run the following code in the RStudio Console pane.
You will then follow the prompts to select and complete the desired lesson.
Git and GitHub
GitHub is a code sharing website. Modern computing is highly collaborative and GitHub is a very popular platform for sharing and collaborating on coding projects. The lab exercises for this textbook are shared on GitHub. To access and complete these exercises you will need to sign up for a (free) GitHub account and then set up the version control software git on your computing environment. git is the conduit to interfacing GitHub and for many git will already be installed on your computer (or cloud computing environment). To verify your installation (or for installation instructions) and to set up your git configuration, consult the very useful Happy Git and GitHub for the useR chapter Install Git.
Getting help
The technologies employed in this approach to text analysis will include a somewhat steep learning curve. And in all honesty, the learning never stops! Experienced programmers and novices alike require support. Fortunately there is a very large community of programmers who have developed many official support resources and who actively contribute to unofficial discussion forums. Together these resources provide ample methods for overcoming any challenge.
The easiest and most convenient place to get help with either R or RStudio is through the RStudio “Help” toolbar menu. There you will find links to help resources, guides, and manuals. R packages often include “Vignettes” (long-form documentation and demonstrations). These can be accessed either by running browseVignettes() in the RStudio Console pane or by searching for the package using a search engine in your web browser and consulting the package documentation there (e.g. usethis). For some of the more common packages you can find cheatsheets on the RStudio website.
For Git and GitHub I recommend Happy Git and GitHub for the useR but the official Git and GitHub documentation pages are great resources as well.
There are a number of very popular discussion forum websites where the programming community asks and answers questions to real-world issues. These sites often have subsections dedicated to particular programming languages or software. Here is a list of some of the most useful in my experience:
The take-home message here is that you are not alone. There are many people world-wide that are learning to program and/ or contribute to the learning of others. The more you engage with these resources and communities the more successful your learning will be. As soon as you are able, pay it forward. Posting questions and offering answers helps the community and engages and refines your skills –a win-win.
Activities
What: Intro to Swirl
How: In the R Console pane load swirl, run
swirl(), and follow prompts to select the lesson.
Why: To familiarize you with navigating, selecting, and
completing swirl lessons.
What: Literate
programming I
How: Read Recipe 1 and participate in the Hypothes.is
online social annotation.
Why: To introduce the concept of Literate Programming
using R, RStudio, and R Markdown.
What: Literate programming I
How: Clone, fork, and complete the steps in Lab
1.
Why: To put literate programming techniques covered in
Recipe 1 into practice. Specifically, you will create and edit an R
Markdown document and render a report in PDF format.
Summary
In this preface I’ve provided the rationale and aims of this textbook. The structure of the texbook and the associated resources work to scaffold your learning and proficiency in the areas of Data literacy, Research skills, and Programming skills. The textbook include a series of conventions to signal important concepts, questions to explore, and resources available. As in the area of Data Science in general, quantitative text analysis is most effectively conducted using programmatic approaches. The process will not be without challenges but the gains are well worth the effort. I’ve outlined key resources to obtain support that are invaluable for the novice as well as the seasoned practitioner.